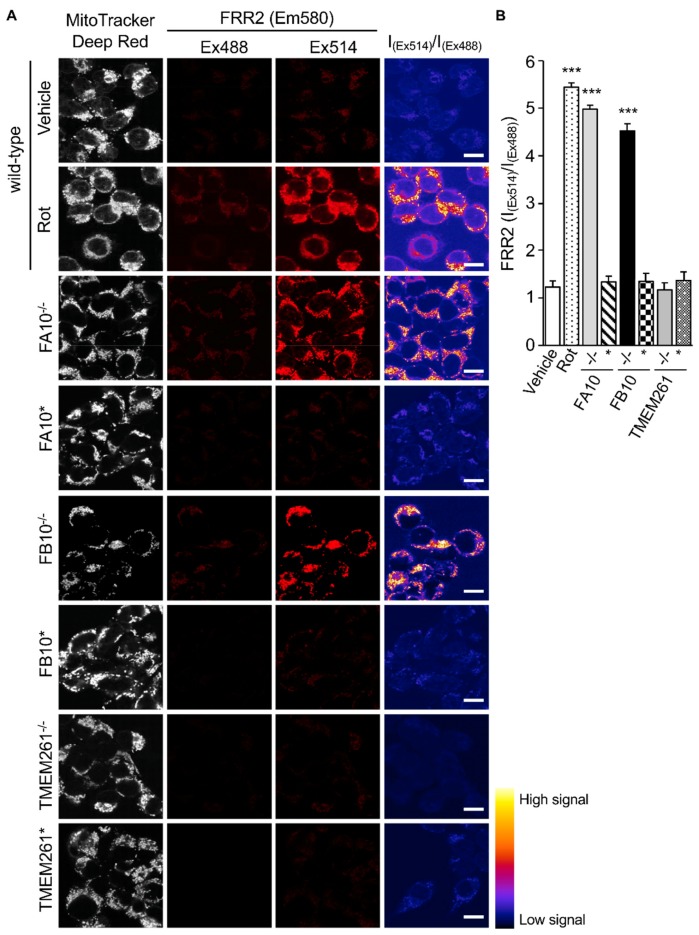
Figure 4.
Human embryonic kidney cells lacking Complex I activity show elevated mtROS production. HEK293T cells and KO derivatives, FA10−/−, FB10−/−, or TMEM261−/−, as well as retrovirus-rescued controls thereof, FA10*, FB10*, or TMEM261*, were assessed for mtROS generation. (A) Cells were stained for Mitotracker Deep Red and the mitochondria-specific ROS probe FRR2, as per Figure 2A. The ratiometric output images of I(Ex514)/I(Ex488) were calculated, as per Figure 2A. (B) FRR2 (I(Ex514)/I(Ex488)) was calculated for the mitochondrial regions defined by Mitotracker Deep Red staining in the I(Ex514)/I(Ex488) images, such as those in A, using a custom CellProfiler pipeline, as per Figure 2B. Results represent the mean ± SEM for n = 3 independent experiments, where each experiment analyzed 25–30 cells per sample. *** p < 0.001 compared to the rescued or wild-type cells.

