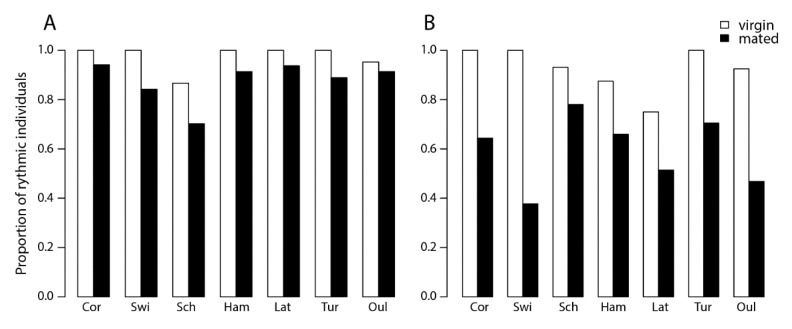
Figure 1.
Proportion of rhythmic Nasonia vitripennis individuals in populations originating from seven locations in Europe in (A) males and (B) females. Locations along the x-axis are arranged from lower to higher latitude, see text for locality details. Generalized linear model (GLM) statistical analysis: effect of sex: χ2 = 65.71, p < 0.01; effect of location χ2 = 33.00, p < 0.01, in both females and males (effect of location: for females χ2 = 13.28, p < 0.05; for males χ2 = 13.46, p < 0.05); effect of latitude: χ2 = 1.77, p = 0.18, in both females and males (effect of latitude: for females χ2 = 1.65, p = 0.19; for males χ2= 0.16, p = 0.68); effect of mating status within females: χ2 = 50.25, p < 0.01; effect of mating status within males: χ2 = 12.18, p < 0.01; effect of latitude: for virgin individuals χ2 = 2.22, p = 0.13 and for mated individuals χ2 = 1.60, p = 0.20. (OUL = Finland, Oulu; TUR = Finland, Turku; LAT = Latvia; HAM = Germany, Hamburg; SCH = Germany, Schlüchtern; SWI = Switzerland; COR = France, Corsica.

