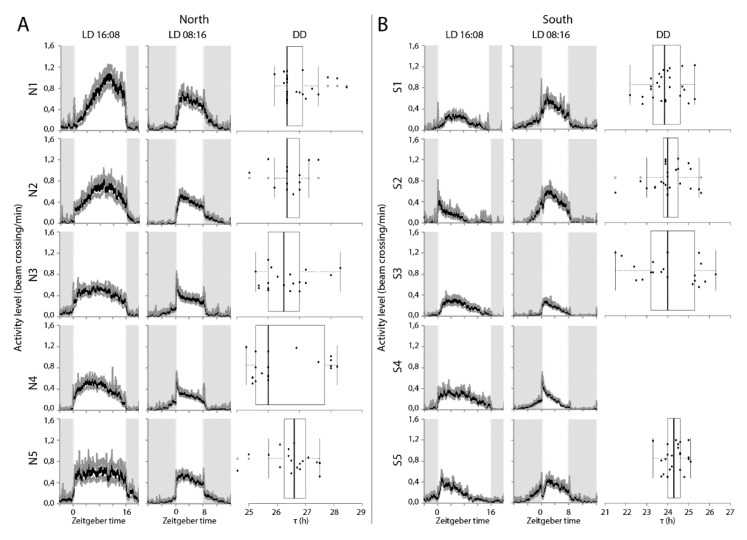
Figure 4.
(A) Locomotor activity profiles for isogenic lines derived from Oulu (65 °N) (N1, N2, N3, N4, N5) and (B) from Corsica (45 °N) (S1, S2, S3, S4, S5) at long (LD16:08) and short (LD 08:16) day regimes. Grey shading indicates the night phase and white shading indicates the day phase. Zeitgeber time is indicated along the X-axis and ZT0 represents the time of light turn-on. Activity was calculated as average of bin crosses/minute of 25–32 individuals each over 24 h periods. Box plots represent the free running period (τ) in constant darkness (DD). Box plots depict the median (thick horizontal line within the box), the 25th and 75th percentiles (box margins) and the 1.5 interquartile range (thin horizontal line). Note that Line S4 is not rhythmic under DD. Note different scale on x-axis for A and B panels.

