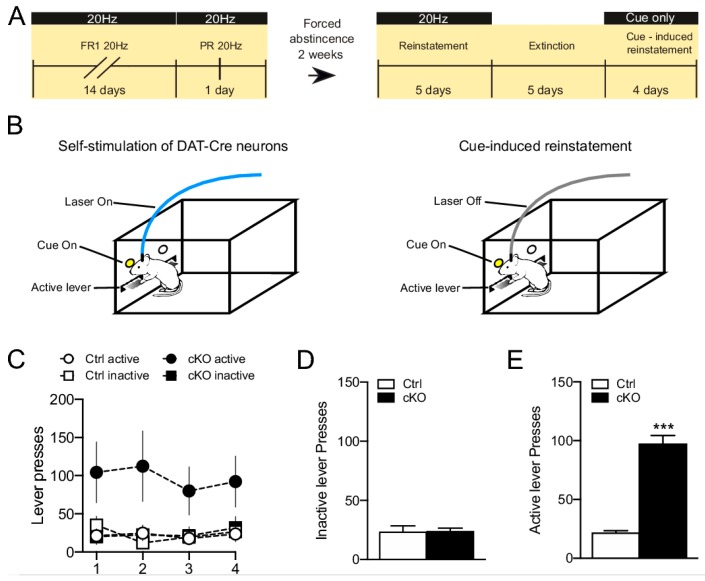
Figure 7.
(A). Timeline of the intracranial optogenetic self-stimulation (ICSS) experiments. (B). Schematic representation of the ICSS procedure and the cue-induced reinstatement phase. (C). Active and inactive lever presses during the cue-induced reinstatement period for cKO and control mice. (D,E). Average of inactive (D) and active (E) during the cue-induced reinstatement phase cKO and Ctrl mice. Data are presented as mean ± SEM. *** p < 0.001 vs. ctrl. Ctrl n = 3, cKO n = 3. Original data, Bimpisidis and Wallén-Mackenzie, pilot study, 2019.

