Figure 6.
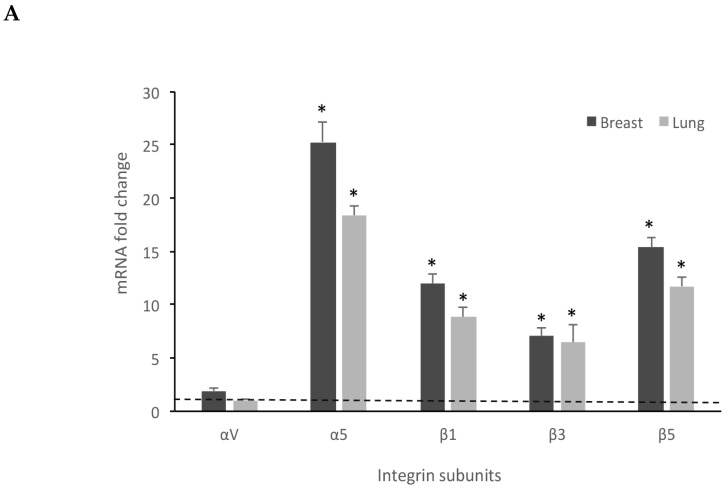
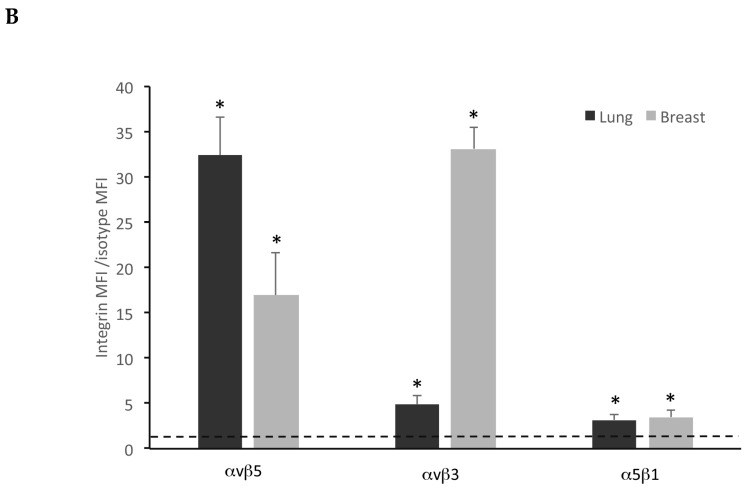
Breast and lung spheroids express integrin subunits. (A) Breast and lung spheroids, compared to the corresponding MCF-7 and A549 cell lines grown as monolayer, display an increased mRNA expression of α5, β1, β3, β5 integrin subunits, measured by quantitative real-time RT-PCR, while αv mRNA appears not to significantly vary in both breast and lung spheroids. Data are expressed as fold change, calculated by the ΔΔ-Ct method. Dotted line: fold increase = 1. * p < 0.05 compared to the controls (MCF-7 and A549 grown as monolayers, under differentiating conditions). (B) The expression of integrin receptors on the cell surface was assessed by FACS analysis: both lung and breast spheroid-derived cells express αvβ5, αvβ3, α5β1 integrin receptors. Data are expressed as ratio between mean fluorescence intensity associated to bound anti-integrin antibodies (Integrin MFI) and mean fluorescence intensity associated to isotypic controls. Dotted line: expression threshold = 1. * p < 0.05 compared to isotypic controls.


