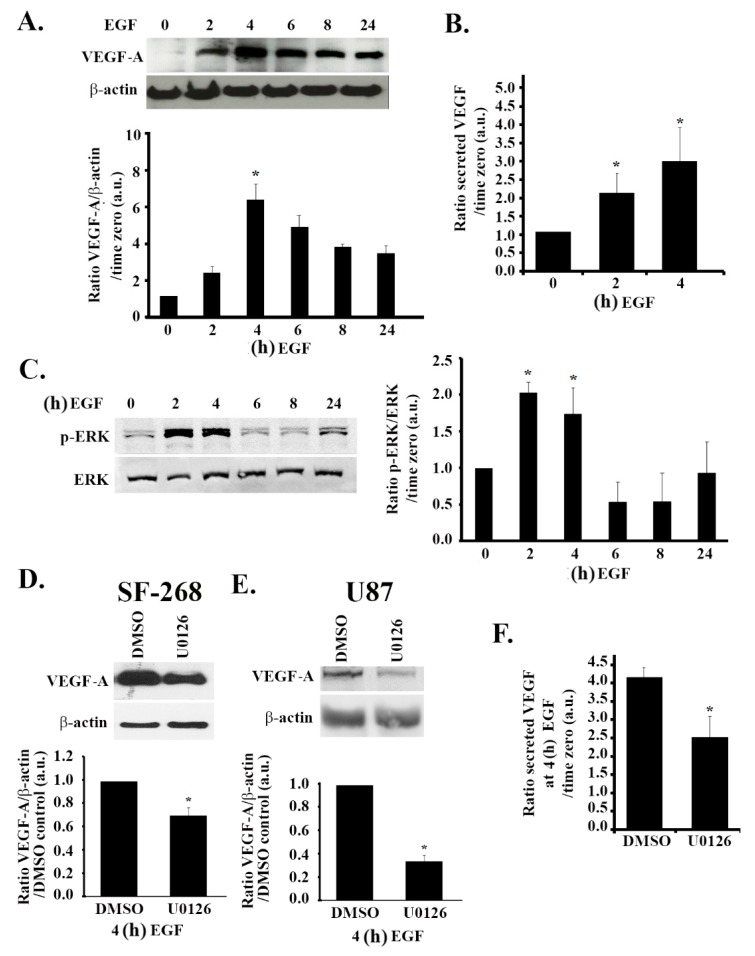
Figure 4.
EGF-induced increase in VEGF expression and secretion is ERK-dependent. (A/C) SF-268 cells were starved in serum-free media for 3 h, then stimulated with 15 nM EGF for the indicated times. Cells were then lysed, and the lysates were blotted for VEGF-A and β-actin (A) or p-ERK and ERK (C). The graphs in each panel are densitometric analysis of the Western blots using Image J. Values are normalized to the loading control (β-actin and ERK for VEGF and p-ERK, respectively) and expressed as fold change compared to time zero (− EGF). (B) ELISA for supernatants from SF-268 cells treated with EGF for 2 or 4 h or left untreated and measured for VEGF-A secretion according to the manufacturer’s guidelines. Values are expressed as fold change compared to time zero. (D) SF-268 cells were treated with 50 μM U0126 for 24 h (with DMSO as carrier). Cells were then treated with 15 nM EGF for 4 h and lysed, and cell lysates were blotted for VEGF-A or β-actin for loading control. The graphs are quantitations of the VEGF bands normalized to actin and expressed as fold change compared to control (DMSO). E) U87 cells were treated with 50 μM U0126 for 24 h (with DMSO as a carrier). Cells were then treated with 15 nM EGF for 4 h and lysed, and cell lysates were blotted for VEGF-A or β-actin for loading control. The graphs are quantitations of the VEGF bands normalized to actin and expressed as fold change compared to control (DMSO). (F) Supernatants from SF-268 cells treated with U0126 or DMSO alone and then treated with EGF for 4 h (after 3 h starvation) were collected and measured for VEGF-A secretion according to the manufacturer’s guidelines. Values are expressed as fold change at every treatment to time zero (− EGF). The data are means ± SEM from three different experiments; * p < 0.05 indicates statistically significant differences.

