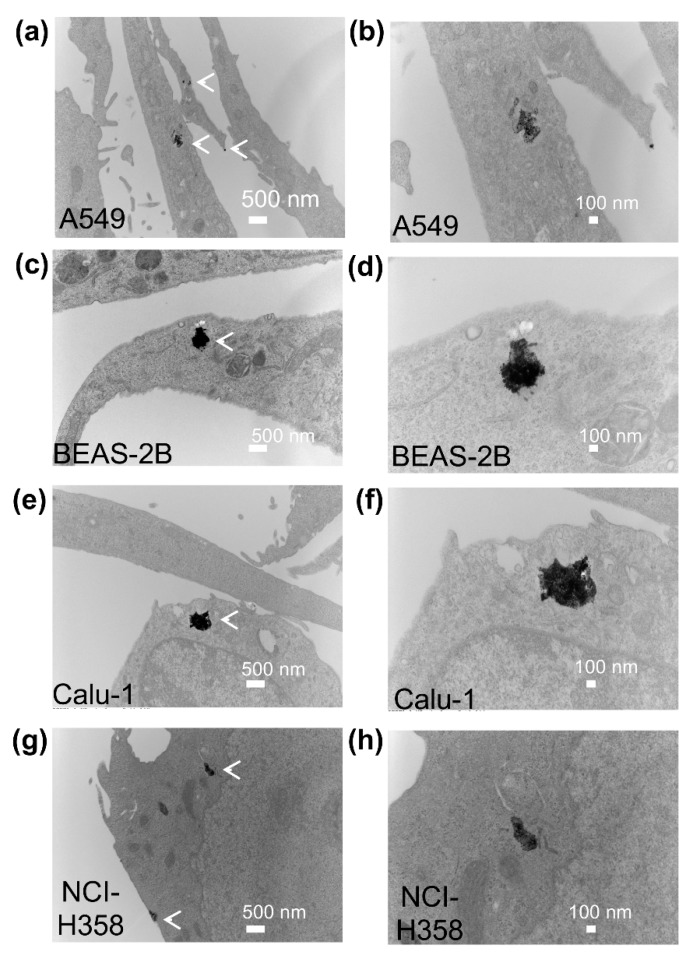
Figure 2.
Uptake and localization of AgNPs in lung cell lines. The subcellular localization of AgNPs in A549 (a,b), BEAS-2B (c,d), Calu-1 (e,f), and NCI-H358 cells (g,h) was imaged by transmission electron microscopy 1 h after cells were exposed to AgNPs (10 μg/mL). Representative images are shown. Magnification was 11,000× for (a,c,e,g). Additional images of the areas shown in the left panels are included at higher magnification (30,000×) in the panels on the right (b,d,f,h). Clusters of AgNPs in vesicles are identified by white arrows in the lower magnification images.

