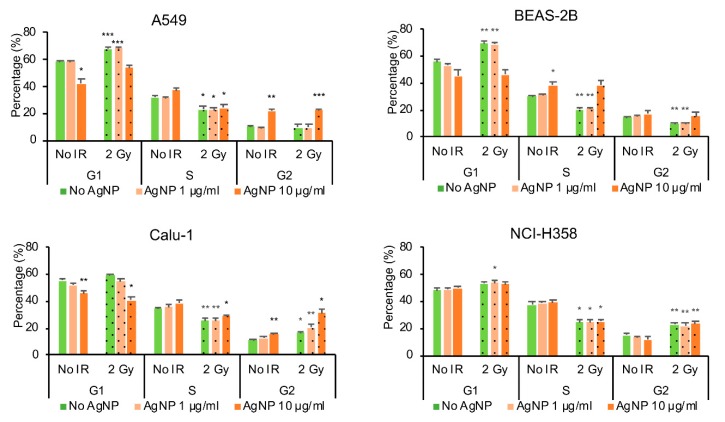
Figure 3.
Effect of AgNP exposure and ionizing radiation (IR) on the cell cycle The cells were treated with 10 μg/mL AgNPs for 24 h and 2 Gy IR immediately after the start of the AgNP exposure, stained with PI and analyzed by flow cytometry 24 h after AgNP exposure and IR. Data are presented as mean value, and the error bars represent the standard error of the mean. * p = 0.01–0.05, ** p = 0.001–0.01, *** p < 0.001, calculated relative to the untreated conditions using Students’ t-test.

