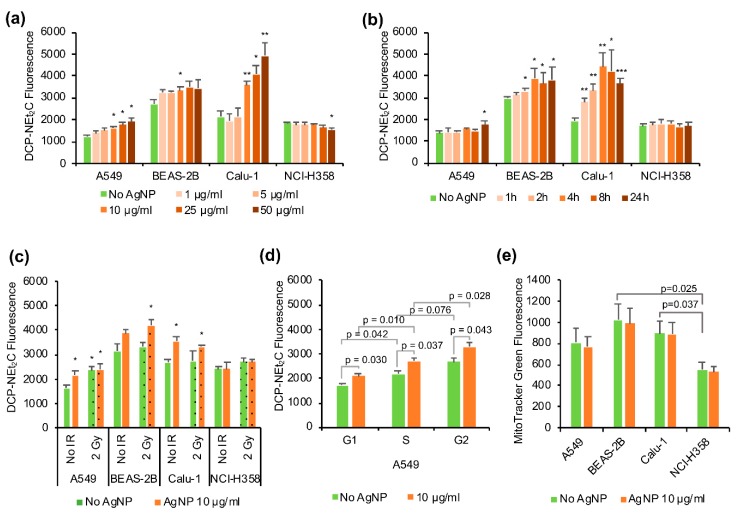
Figure 5.
Mitochondrial protein oxidation and mitochondrial content. (a) Changes in mitochondrial protein oxidation with different AgNP exposure times. The cells were treated with 10 μg/mL AgNPs for different time durations as indicated, stained with DCP-NEt2C and analyzed by flow cytometry. (b) Changes in mitochondrial protein oxidation with different doses of AgNPs. The cells were treated for 24 h with different doses of AgNPs as indicated, stained with DCP-NEt2C and analyzed by flow cytometry. (c) Effect of AgNPs exposure combined with ionizing radiation (IR). The cells were treated with 10 μg/mL AgNPs for 24 h and 2 Gy IR immediately after the start of the AgNP exposure, stained with DCP-NEt2C and analyzed by flow cytometry. (d) Mitochondrial protein oxidation in different cell cycle phases. The A549 cells were treated with 10 µg/mL AgNPs for 24 h, stained with DCP-NEt2C and PI and analyzed by flow cytometry. (e) Mitochondrial content in different cell lines was measured with MitoTracker Green. Cells were treated with 10 μg/mL AgNP for 24 h, stained with MitoTracker Green and analyzed by flow cytometry. Data are presented as mean relative fluorescence, the error bars represent the standard error of the mean. * p = 0.01–0.05, ** p = 0.001–0.01, *** p < 0.001, calculated relative to the untreated conditions using Students’ t-test.

