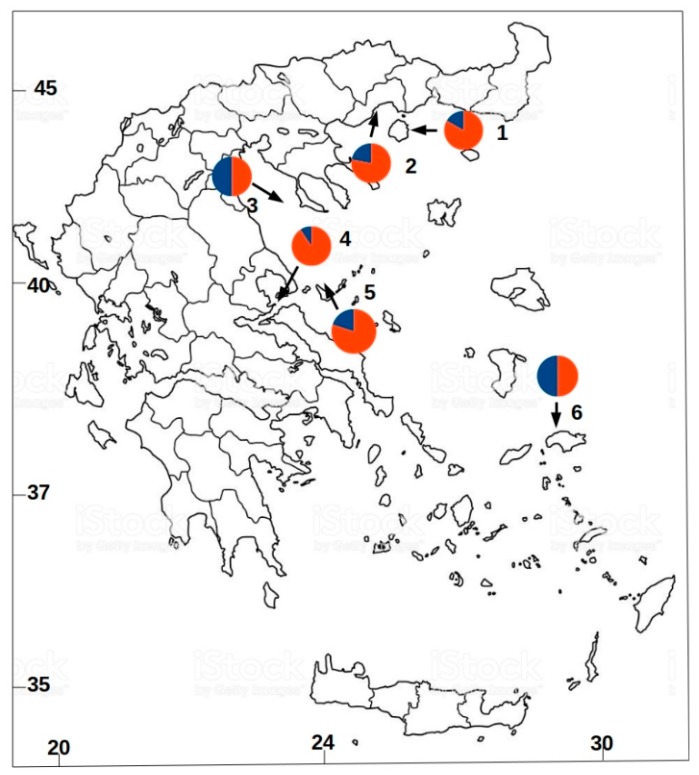
Figure 1.
Sampling locations in the Aegean Sea and structure pies with locprior K = 2 (different colors represent the two different genetic clusters). Numbers indicate the sampled area of individuals. 1: Thasos (THA)—30 specimens; 2: Kavala (KAV)—24 specimens; 3: Chalkidiki (CHA)—28 specimens; 4: Trikeri (TRI)—28 specimens; 5: Sporades (SPO)—26 specimens; 6: Samos (SAM)—30 specimens.

