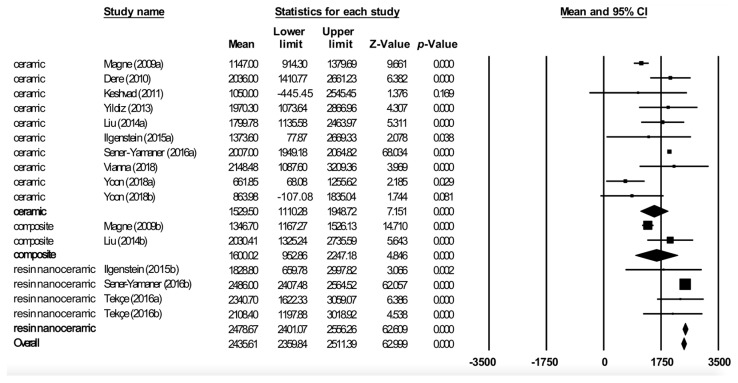
Figure 4.
Forest plot of meta-analysis of materials subgroups (ceramic, composite, and resin nanoceramic). The size of the square represents the weight of each study and the diamond represents the combined results of the meta-analysis. CI is the 95% confidence interval of the mean between a lower and an upper limit.

