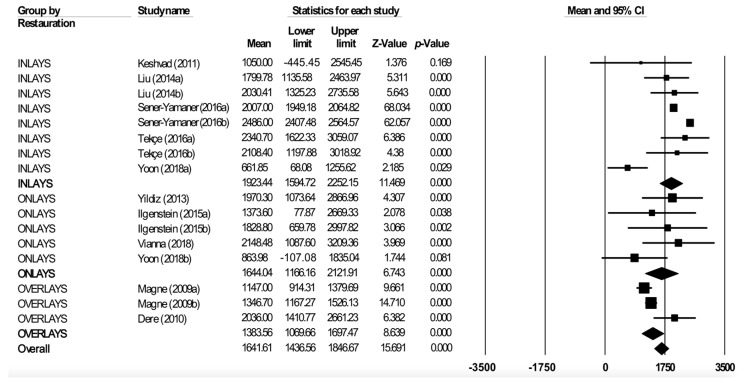
Figure 5.
Forest plot of meta-analysis of subgroups according to restoration type (inlays, onlays, and overlays). The size of the square represents the weight of each study and the diamond represents the combined results of the meta-analysis. CI is the 95% confidence interval of the mean between a lower and an upper limit.

