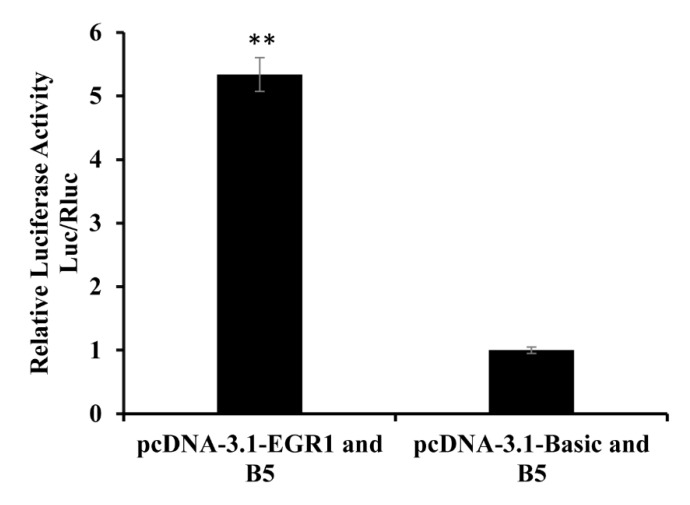
Figure 6.
Relative activity analysis of EGR1. Note that for pcDNA-3.1-EGR1 and B5, the EGR1 overexpression vector was co-transfected with the B5 fragment; for pcDNA-3.1-Basic and B5, the pcDNA-3.1 vector was co-transfected with the B5 fragment. The group of pcDNA-3.1-Basic and B5 was the control group. The marker “**” represents a highly significant difference (p < 0.01).

