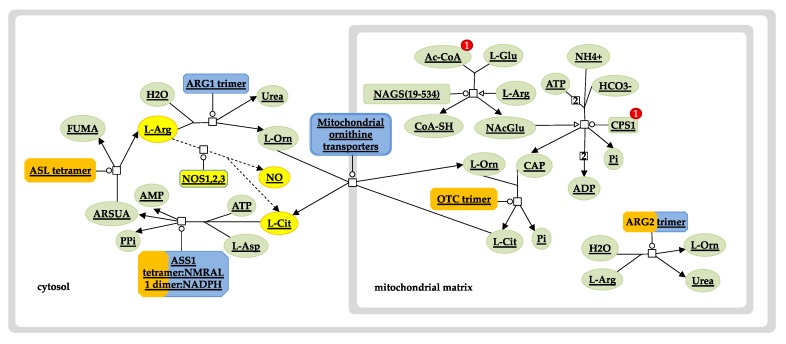
Figure 6.
Urea cycle and nitric oxide pathway. Diagram depicts enzymes and intermediates of the urea cycle (solid lines) and the nitric oxide (NO) pathway (dashed lines, yellow nodes). Overrepresentation of the Hb F-related gene set used in the analysis is shown in orange. The size of the orange strip increases with the level of gene representation in the query set. The urea cycle pathway was exported from the Reactome pathway database and edited to include and highlight the role of NO shown in yellow. Ac-CoA, acetyl coenzyme A; AMP, adenosine monophosphate; ARG1, arginase 1; ARG2, arginase 2; ARSUA, argininosuccinate; ASL, arginosuccinate lyase; ASS1, arginosuccinate synthase; ATP, adenosine triphosphate; CAP, carbamoyl phosphate; CoA-SH, coenzyme A; CPS1, carbamoyl phosphate synthase 1; FUMA, fumarate; L-Arg, L-arginine; L-Asp, L-aspartate; L-Cit, L-citrulline; L-Glu, L-glutamine; L-Orn, L-ornithine; NAcGlu, N-acetylglutamic acid; NAGS, N-acetylglutamate synthase; NOS1,2,3, nitric oxide synthase 1 (neuronal, nNOS), 2 (inducible, iNOS), 3 (endothelial, eNOS); OTC, ornithine transcarbamylase; Pi, inorganic phosphate; PPi, inorganic pyrophosphate.

