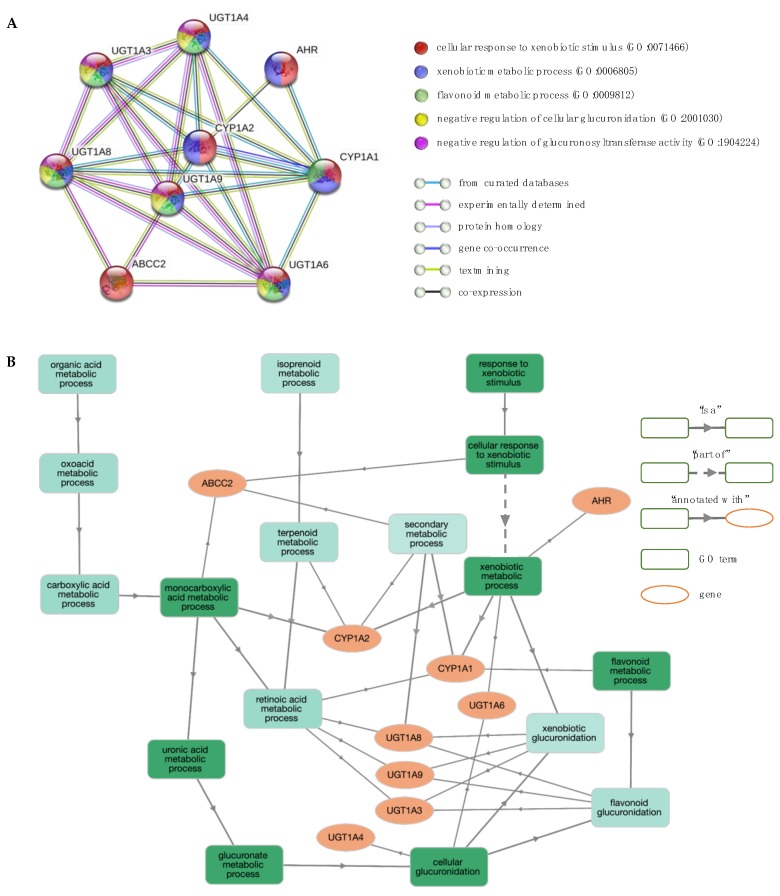
Figure 7.
Network and enrichment analysis for response to iron chelators. (A) The PPI network contains nine nodes (proteins; circles) connected by edges (protein–protein interactions). The most significant GO BP terms are shown. (B) GO BP enrichment analysis using GOnet (q value ≤0.01; p value ≤5.3 × 10⁻⁹). Green colour intensifies as the significance level of enrichment decreases.

