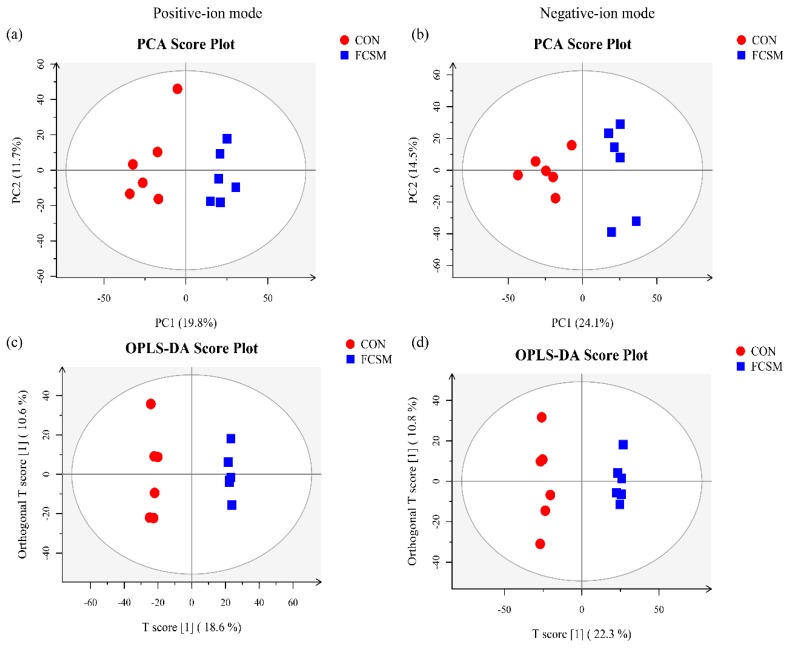
Figure 2.
Principal component analysis (PCA), and orthogonal projections to latent structures-discriminant analysis (OPLS-DA) score plots analysis of LC-MS/MS data in positive-ion mode and negative-ion mode between CON and FCSM groups. CON, no fermented cottonseed meal in diet; FCSM, 6% fermented cottonseed meal in diet. (a) principal component analysis (PCA) in positive-ion mode. (b) Principal component analysis (PCA) in negative-ion mode. (c) OPLS-DA score plots in positive-ion mode. (d) OPLS-DA score plots in negative-ion mode.

