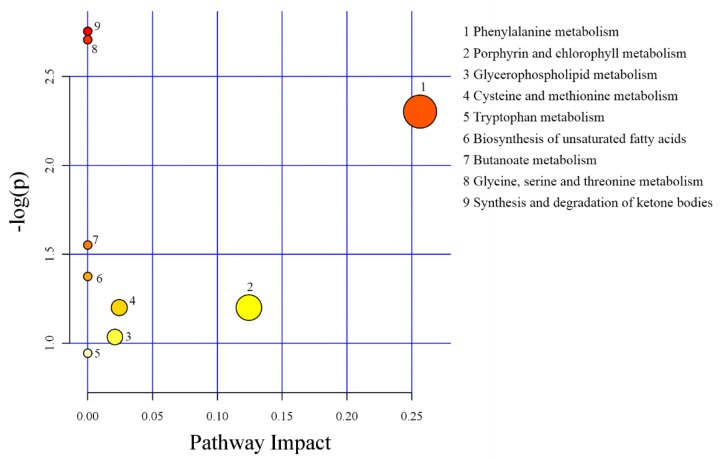
Figure 3.
Pathway analysis of differential metabolites in serum between CON and FCSM groups using MetaboAnalyst 3.0. CON, no fermented cottonseed meal in diet; FCSM, 6% fermented cottonseed meal in diet. The colour of the circles from white to yellow to red denotes incremental fold change (−log(p)). The size of the circles from small to large indicates an increment of pathway impact.

