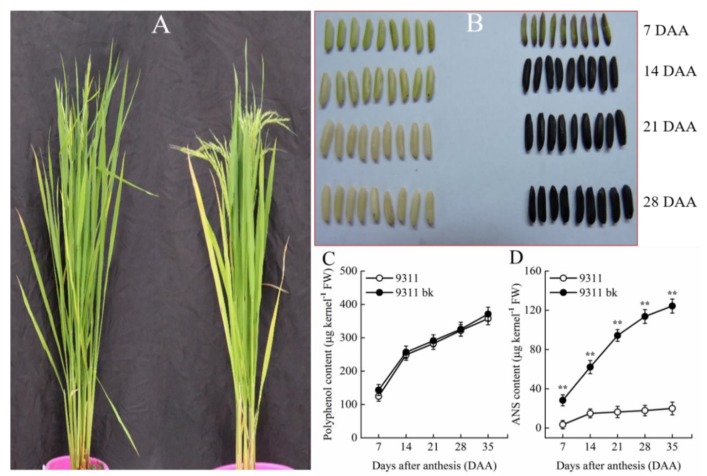
Figure 1.
Comparison of plant phenotypes between bk mutant (9311bk) and its wild type (9311) at heading stage. (A) Plant growth phenotype, left: 9311 and right: 9311bk. (B) Grain appearance (the samples harvested at 7 days interval after anthesis), left: 9311 and right: 9311bk. (C) Temporal pattern of polyphenol content and (D) Temporal pattern of anthocyanin (ANS) content during kernel development. DAA indicates the days after anthesis. Vertical bars represent standard errors (n = 3). The asterisks represent significant differences (** p < 0.01).

