Figure 3.
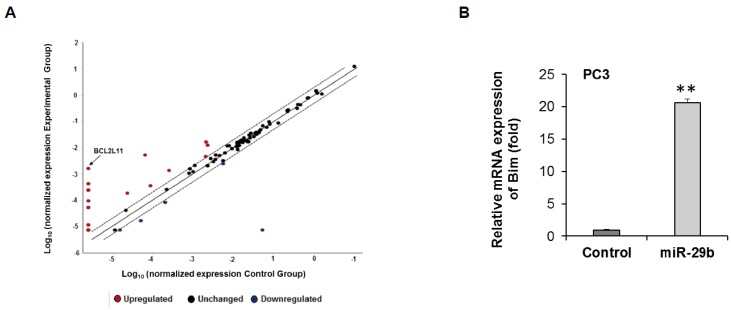
Transcriptomic analysis of miR-29b mimic transfected PC3 cells. (A) RNAs from control or miR-29b transfected PC3 cells were analyzed for pathway specific transcriptomic array using Human Cancer Pathway Finder RT2 profiler PCR Array (Qiagen). Relative fold change was analyzed using web-based software (Qiagen) using human β-Actin, β-2-microglobulin, glyceraldehyde-3-phosphate dehydrogenase, hypoxanthine phosphoribosyl transferase 1 and ribosomal protein, large, P0 genes as endogenous controls and presented graphically. (B) Total RNA was isolated from control or miR-29b transfected PC3 cells. Bim expression was measured by qRT-PCR and GAPDH was used as an internal control. The results are presented as mean ± SD from three independent experiments (**, p < 0.001).

