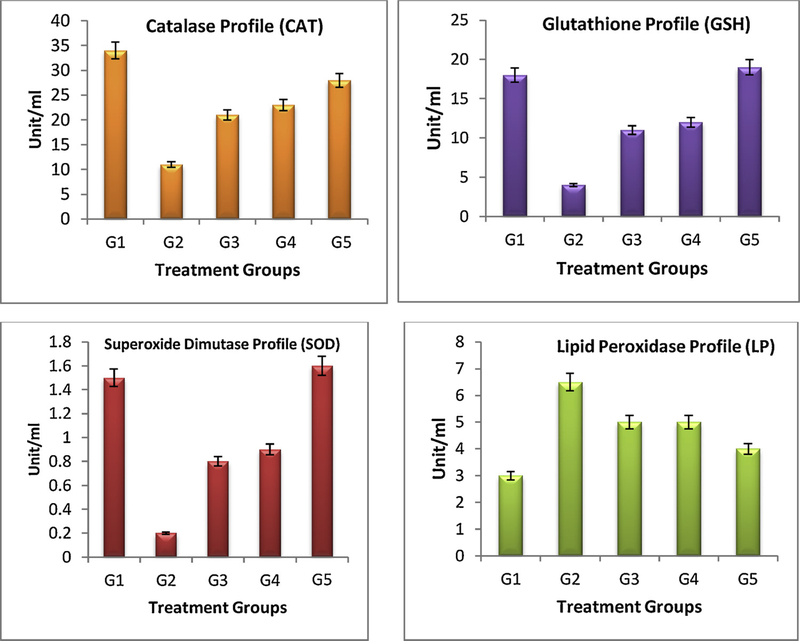
Fig. 7.
Blood biochemical parameters analysis of control (G1 & G2) and treatment (G3-G5) mice is shown. It is observed that mice treated with G4 and G5 have elevated levels of antioxidant enzymes (GTH, CAT and SOD) and lowering of lipid peroxidase (LP) levels when compared to the G2 control and G3 treated formulation, p < 0.05, n = 6.

