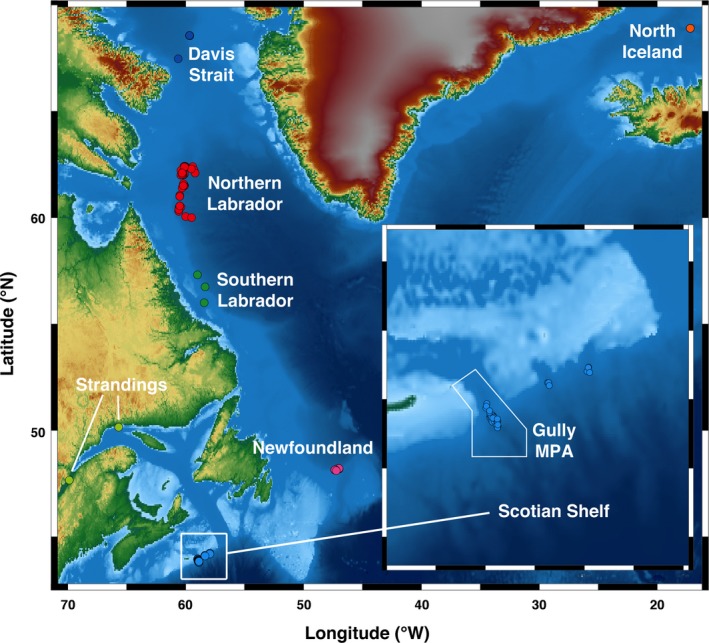
Figure 2.

Location map of successfully sequenced samples across the study area, with inset of the Scotian Shelf. Circles indicate a sample; colors indicate population: Red—Northern Labrador, green—Southern Labrador, pink—Newfoundland, orange—Iceland, light blue—Scotian Shelf, dark blue—Davis Strait, and light green—Stranding
