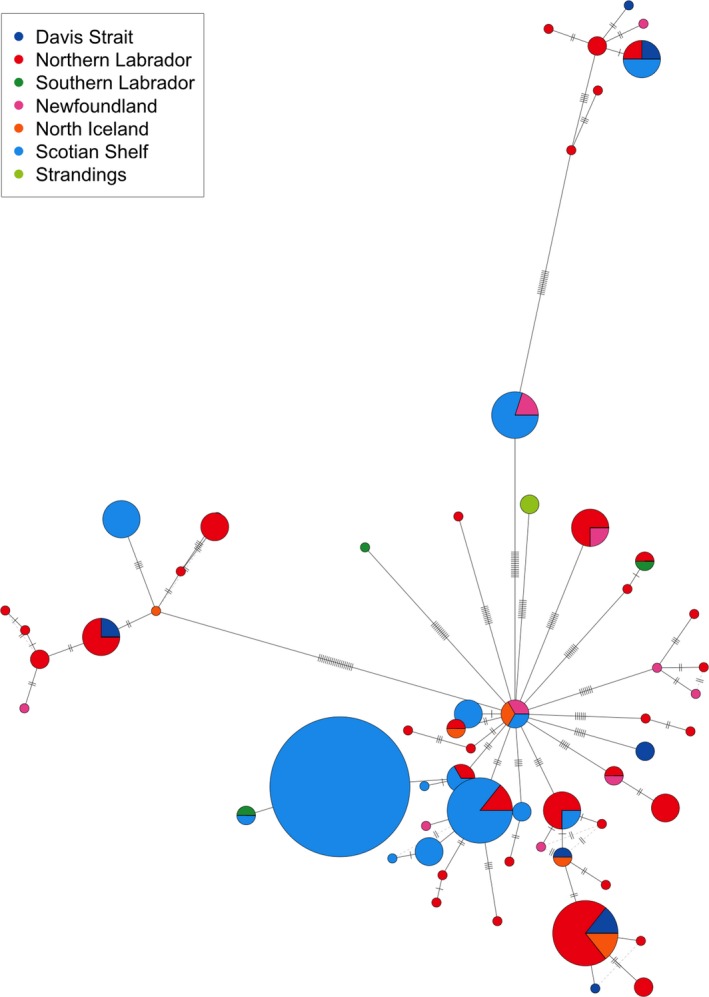
Figure 4.

Median‐joining network of Hyperoodon ampullatus mitogenome haplotypes. Circles represent haplotypes, colors correspond to sampling region, lines and hash marks depict number of sites differing between haplotypes, and circle area is proportional to number of samples for each haplotype. Red—Northern Labrador, green—Southern Labrador, pink—Newfoundland, orange—Iceland, light blue—Scotian Shelf, dark blue—Davis Strait, and light green—Stranding
