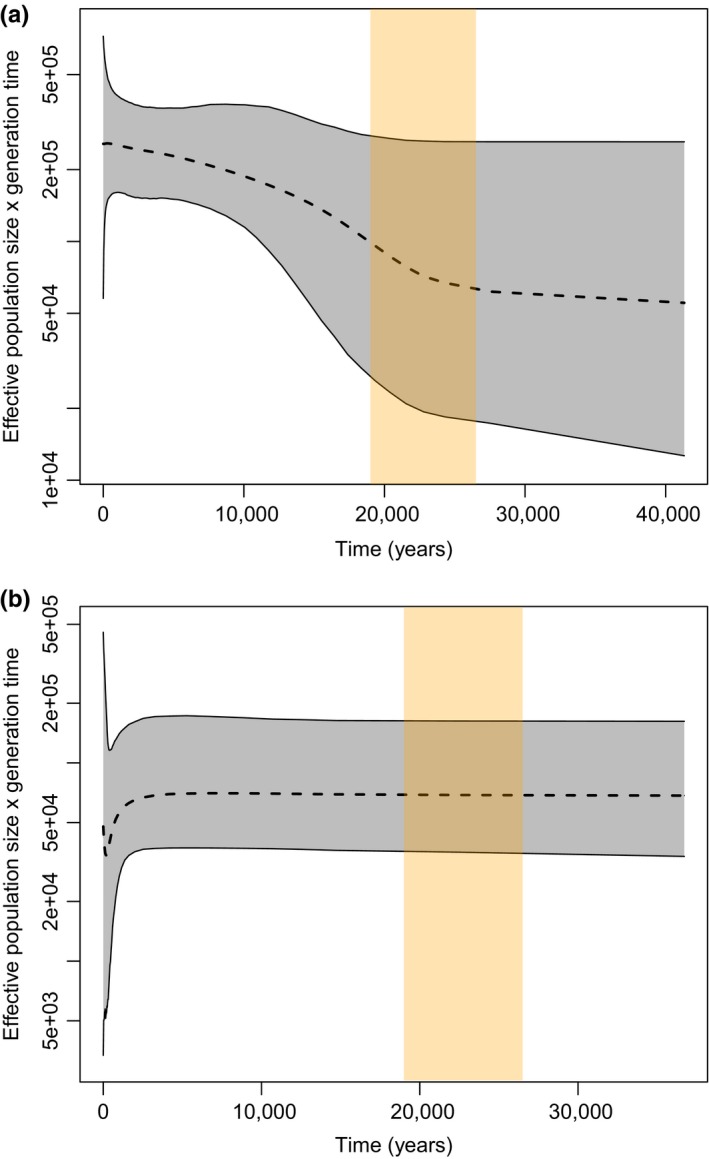
Figure 6.

Extended Bayesian skyline plots for Hyperoodon ampullatus mitogenomes from (a) Northern region and (b) Scotian Shelf. Dashed line represents median reconstructed Ne, with gray shaded areas representing the 95% (highest posterior density intervals) HPDI. Beige shaded bar indicates the estimated duration of the last glacial maximum. Y‐axes are logarithmic. In the Scotian Shelf, effective population size reaches maximum rate of decline at ~350 years and minimum value at ~180 years
