Figure 6.

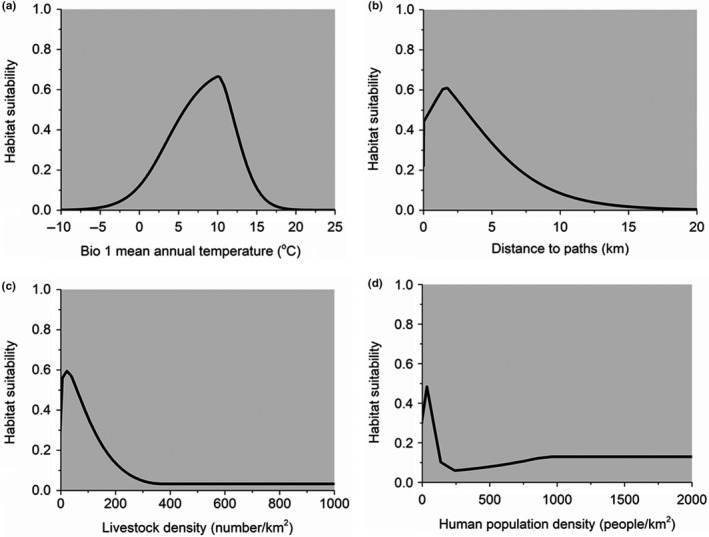
Response curves showing the relationship between habitat probability of red pandas and the top four contributed variables. The response curves were derived from the model using both environmental and anthropogenic variables

Response curves showing the relationship between habitat probability of red pandas and the top four contributed variables. The response curves were derived from the model using both environmental and anthropogenic variables