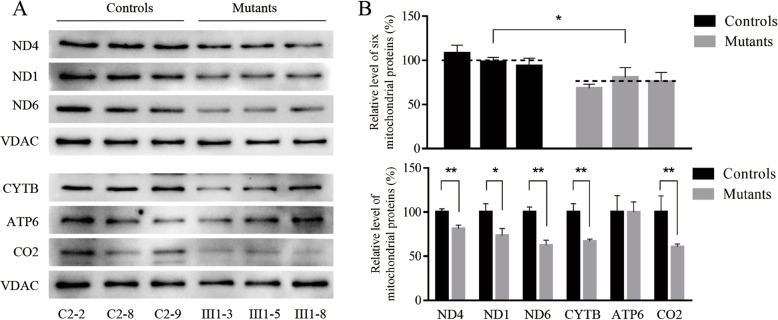
Fig. 3.
Western blot analysis of mitochondrial proteins. a Twenty micrograms of total cellular proteins from various cell lines were electrophoresed through a denaturing polyacrylamide gel, electroblotted and hybridized with respiratory complex subunits in mutant and control cells with VDAC as a loading control. b Quantification of 6 respiratory complex subunits. The levels of ND6, ND4, ATP6, CYTB, CO2 and ND1 in three mutant cybrid cell lines and control cybrid cell lines were determined. The error bars indicate two standard errors of the means. p indicates the significance, according to the t-test, of the differences between mutant and control cell lines

