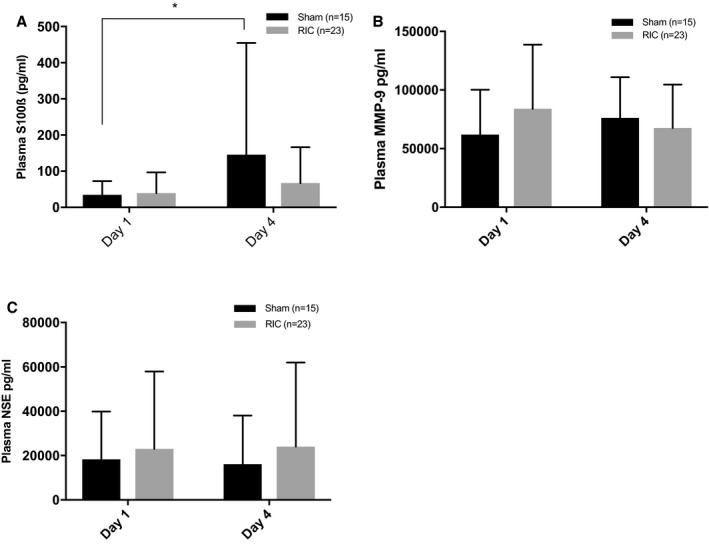
Figure 3.

Plasma S100ß (A), matrix metalloproteinase‐9 (MMP‐9, B), and neuron‐specific enolase (NSE, C) on days 1 and 4 by treatment group. S100ß levels increase by day 4 in the sham group from 34.5 pg/mL (SD 37.8) to 145.6 pg/mL (309.1), mean difference 111 pg/mL (95% CI, 5.6–216; P=0.041*). There were no significant between‐group differences at day 4. Analysis by repeated measures ANCOVA, Sidak correction for multiple comparisons, and adjusted for baseline stroke severity. RIC indicates remote ischemic conditioning.
