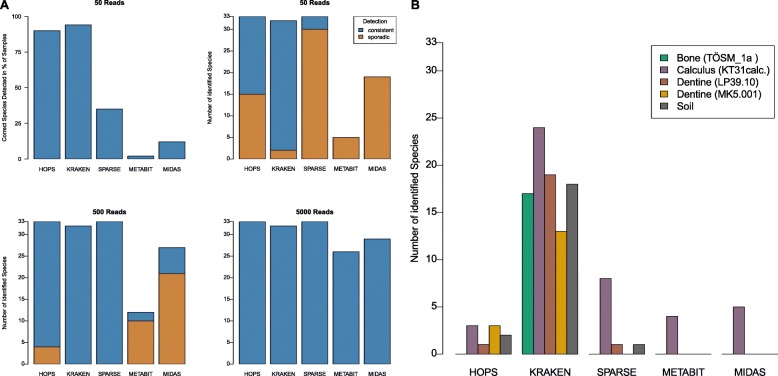
Fig. 5.
Performance comparison of HOPS, Kraken, SPARSE, metaBIT, and MIDAS. a Number of species that have been correctly identified in the simulated data sets by each of the programs. The bar plot on the upper left shows the percentage of data sets with 50 simulated reads for which the correct species has been identified. The other bar plots show the number of species that have been correctly identified in data sets with 50, 500, and 5000 simulated reads, respectively. b Number of target species identified in the metagenomic background (negative controls) without any spiked-in species-derived data for each of the tested programs

