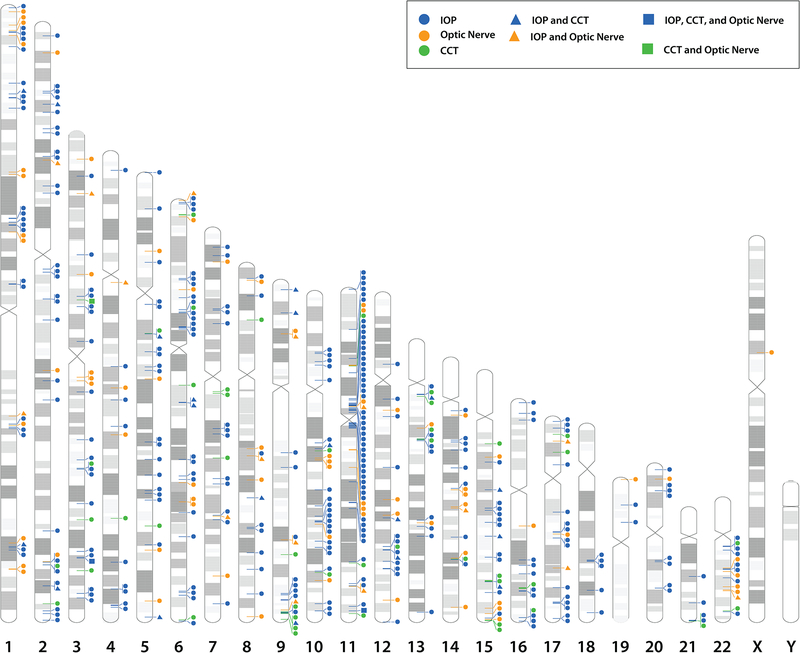
Figure 7.
Human chromosome ideograms (labeled 1 – 22, X and Y) with glaucoma loci, genes and glaucoma risk factor alleles. The glaucoma loci are indicated by black bars on the left side of the chromosome. The glaucoma genes are indicated by the black triangle on the right side of the chromosome. The genes representing glaucoma risk factors of optic nerve (orange circle), intraocular pressure (IOP, blue circle), and central cornea thickness (CCT, red square) are on the right side of the chromosome.

