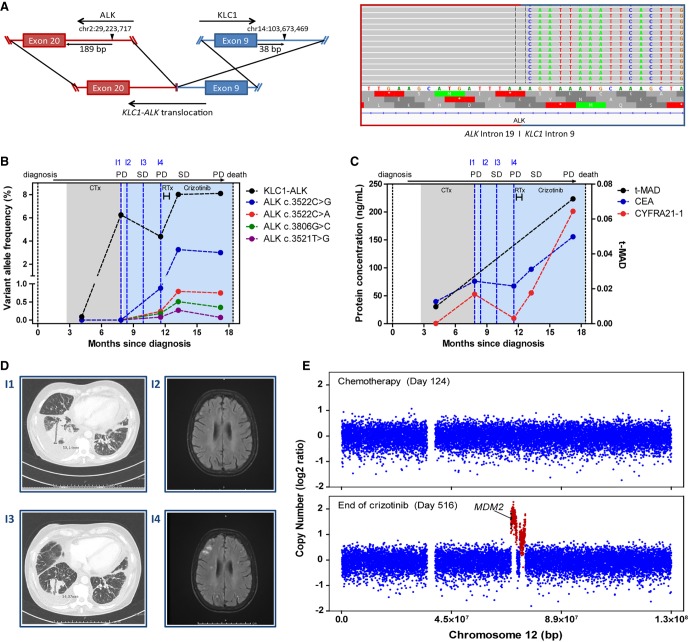
Figure 1.
(A) Schematic of the predicted genomic translocation of KLC1–ALK and aligned ctDNA reads in IGV spanning the rearrangement of KLC1 intron 8 and ALK intron 19. (B) Kinetics of mutated allele frequencies detected in ctDNA during treatment. Corresponding images (I1–I4) are shown in E. Phases of stable disease and progressive disease are indicated on top. (C) Kinetics of serum protein concentrations during treatment. Corresponding images (I1–I4) are shown in D. Phases of stable disease and progressive disease are indicated on top. (D) Corresponding chest CT of the primary tumor (on the left; I1, I3) and brain MRI images of cerebral metastases (on the right; I2, I4) taken during the therapy course. (E) Copy-number profiles of Chromosome 12 from sWGS of ctDNA. The upper panel shows the CNV profile before crizotinib treatment initiation; the bottom panel shows the CNV profile at the end of treatment. (SD) Stable disease, (PD) progressive disease, (CTx) chemotherapy, (RTx) whole-brain radiotherapy.

