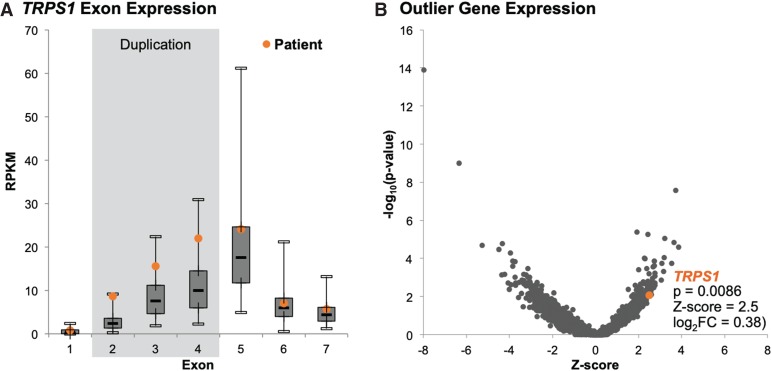
Figure 3.
Gene expression analysis. (A) TRPS1 exonic expression levels in blood RNA of the proband compared to a cohort of 127 individuals differently affected with, or unaffected individuals related to individuals with, suspected rare monogenetic disease. (B) Gene expression changes called by OUTRIDER in this individual compared to the cohort represented as −log10(unadjusted P-value) versus Z-score.

