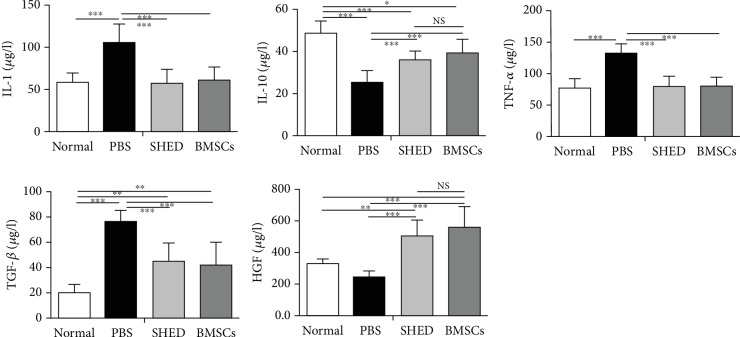
Figure 6.
Serum IL-1, IL-10, TNF-α, TGF-β, and HGF levels were determined by ELISA. ∗P < 0.05, ∗∗P < 0.01, and ∗∗∗P < 0.001. IL-1 and TNF-α were clearly higher in the PBS group than in the other groups, and TGF-β level was lower in the SHED and BMSC groups than in PBS group; IL-10, TGF-β, and HGF levels in the SHED group and BMSC group were between those in the normal group and those in the PBS group.

