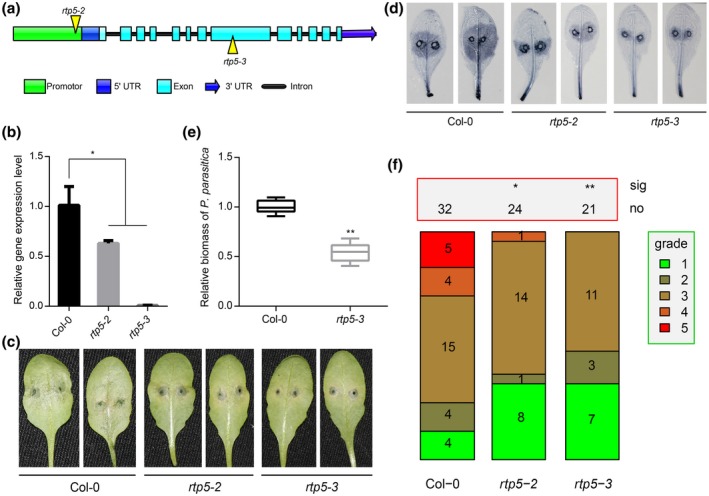
Figure 2.

Arabidopsis thaliana T‐DNA insertion rtp5 mutants showed enhanced resistance to Phytophthora parasitica. (a) Diagram of the T‐DNA insertion sites in rtp5‐2 and rtp5‐3. (b) The qRT‐PCR results indicate that the expression level of AtRTP5 decreased in the T‐DNA insertion mutants. The relative expression levels of AtRTP5 were normalized to AtUBC9. Statistical analysis was determined by one‐way ANOVA followed by Tukey’s multiple comparison tests. (c) Leaf inoculation assay illustrated that the T‐DNA insertion mutant plants were resistant to P. parasitica, scored 3 days post‐inoculation (dpi). More than ten leaves from ten different plants were tested in each experiment, and three independent experiments were performed. (d) Inoculated leaves at 3 dpi were stained with trypan blue. (e) Relative DNA ratio of P. parasitica compared to A. thaliana at 3 dpi (PPTG_09948/AtUBC9) was determined by qPCR. Statistical analysis was determined by Student’s t‐test. (f) The plant disease severity assessment of the infected leaves shown in (c) and (d). All infected leaves were divided into five grades depending on the pathogen colonization area ratio. Grade 1, 0–10%; Grade 2, 10–30%; Grade 3, 30–50%; Grade 4, 50–80%; Grade 5, >80%. Error bars in (b) and (e) indicate SD of three biological replicates. All asterisks indicate significant differences (*P < 0.05, **P < 0.01).
