Figure 3.
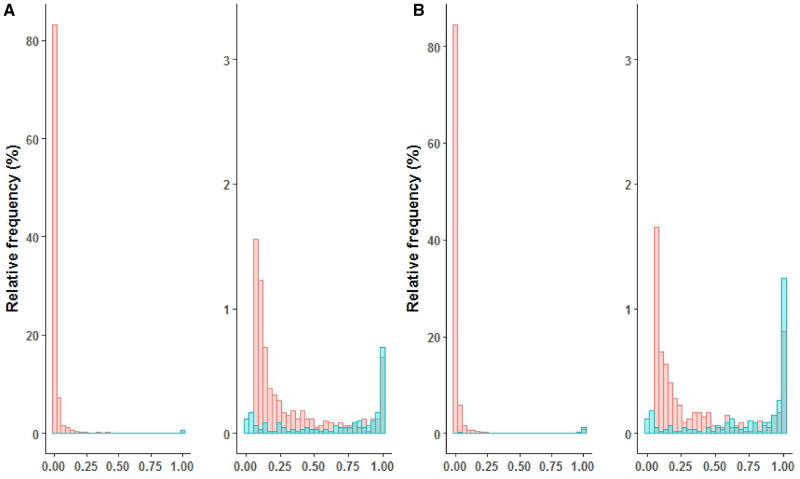
Histogram of estimated probabilities of PA, p (Y=1|X) based on (A) case set A and (B) case set B. The left panels display the probability histogram with the range of y-axis being 0%-100%. The right panels display the zoomed-in probability histogram with y-axis limited to 0%-3%. Labeled cases (blue) and unlabeled patients (red) are indicated.

