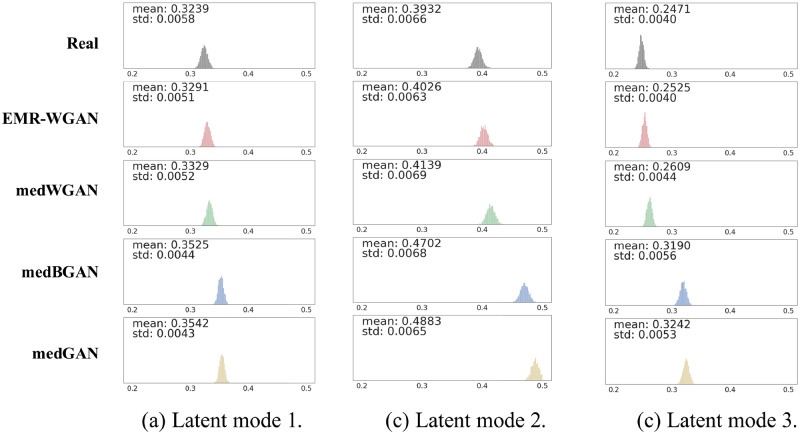
Figure 4.
Latent space representation. Each subfigure illustrates the distribution of the variances in one latent dimension (with mean <0.5). The first row corresponds to real data. Each subsequent row corresponds to synthetic data generated by a particular type of generative adversarial network (GAN). BGAN: boundary-seeking generative adversarial network; EMR: electronic medical record; WGAN: Wasserstein generative adversarial network.

