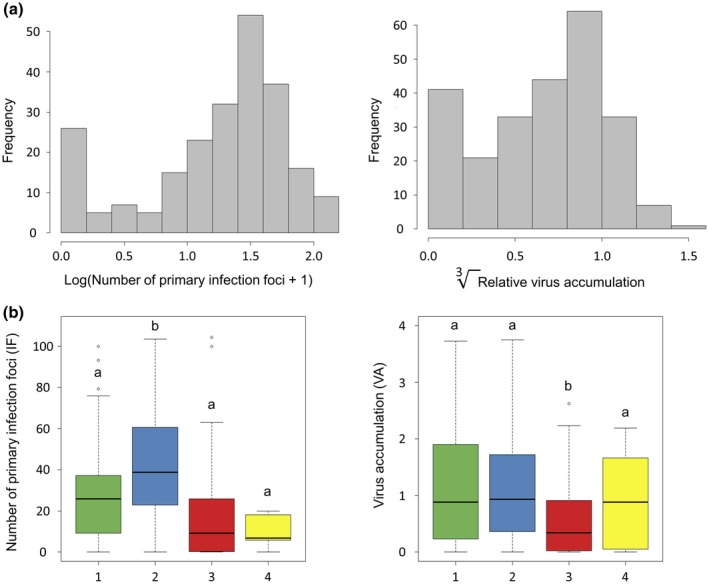
Figure 2.

Potato virus Y resistance in the pepper core collection. (a) Frequency distribution of the number of primary infection foci (IF) caused by PVY‐GFP and of the relative virus accumulation (VA) in the Capsicum annuum core collection. (b) Distribution of IF and VA among the four clusters determined by the STRUCTURE analysis. The letters a and b indicate the different groups obtained after pairwise comparisons using the Nemenyi test (P < 0.05).
