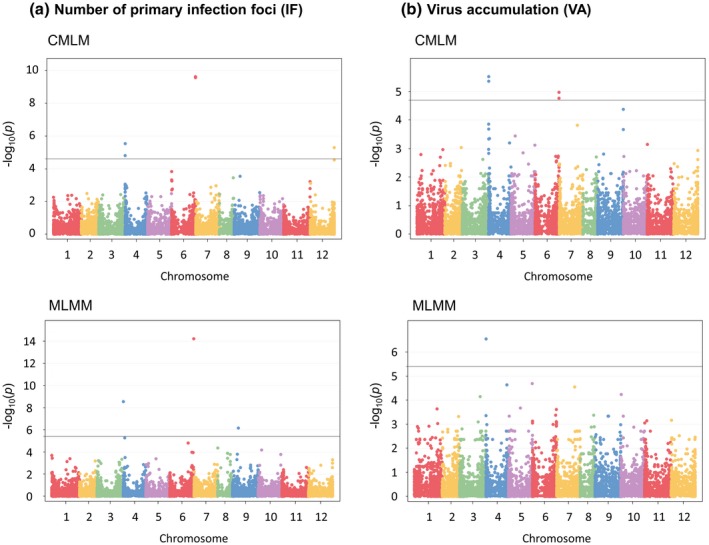
Figure 3.

Manhattan plot of genome‐wide association studies (compressed mixed linear model, CMLM and multilocus mixed‐model, MLMM) for (a) the number of primary infection foci (IF) induced by PVY‐GFP and (b) PVY accumulation (VA). Negative log10(p) from a genome‐wide scan are plotted against SNP positions on each of the 12 chromosomes.
