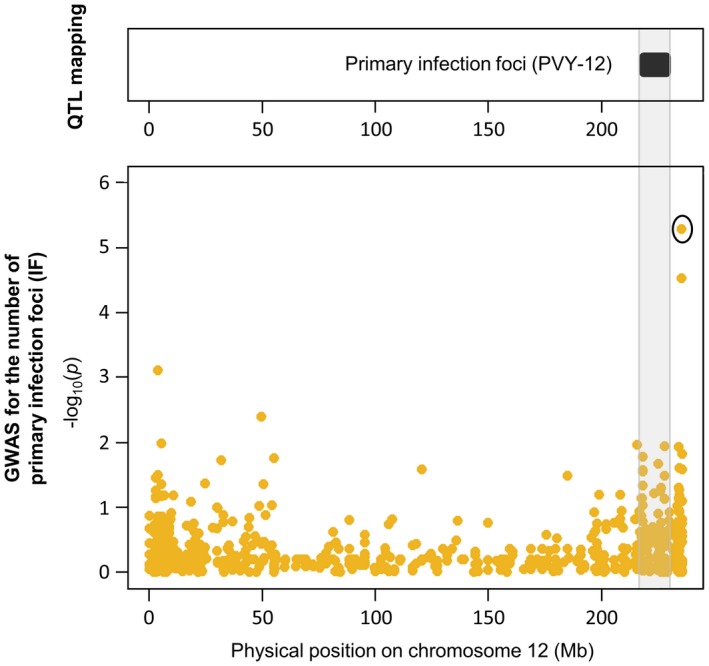
Figure 5.

Genomic regions controlling the number of primary infection foci (IF) on chromosome 12. The PVY‐12 (black) quantitative trait locus (QTL) detected by analysis of a biparental DH progeny in Tamisier et al. (2017) is mapped physically on pepper chromosome (top box). SNPs are represented in Manhattan plots displaying the –log10(p) over genomic positions (bottom boxes). The SNP showing significant association with the trait is surrounded by a black circle. The shaded grey area delimits the boundaries of the PVY‐12 QTL.
