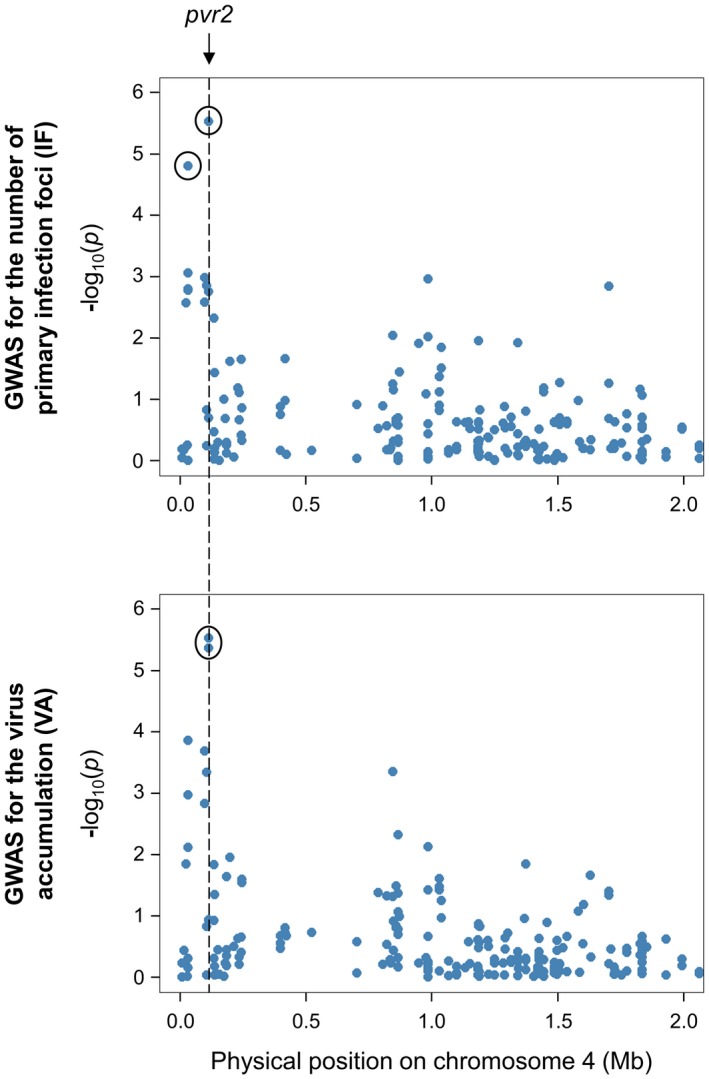
Figure 7.

Comparison between SNPs mapped at the beginning of chromosome 4 (represented in a Manhattan plot displaying the –log10(p) over genomic positions) and the position of the major pvr2 resistance gene on the CM334 reference genome (indicated with a dotted line). The SNPs showing significant association with the number of primary infection foci (IF) and/or virus accumulation (VA) are surrounded by a black circle.
