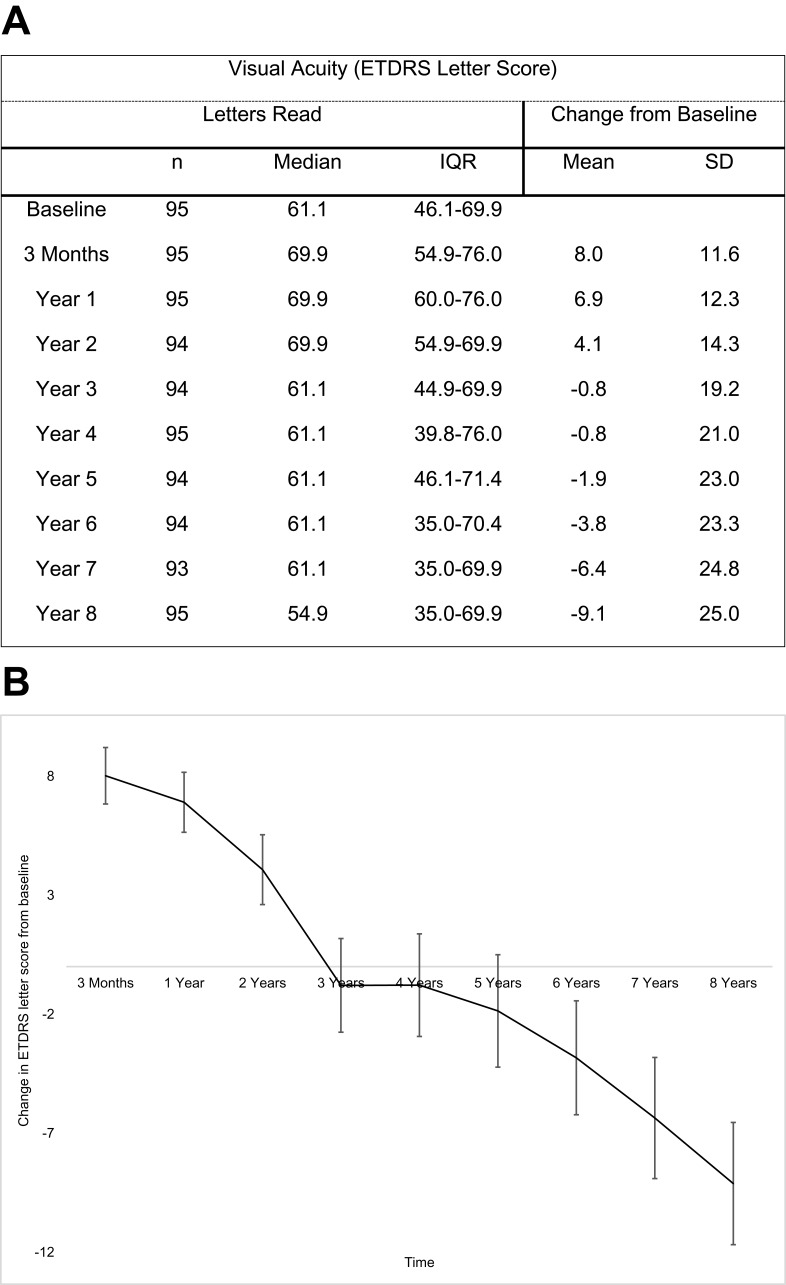
Figure 1.
Evolution of visual acuity in cohort over 8 years. (A) Yearly visual acuity and changes in ETDRS scores in comparison to baseline. (B) Mean change per year in ETRDS letter score in comparison to baseline, including standard error bars.
Abbreviations: n, eyes number; IQR, interquartile range; SD, standard deviation.

