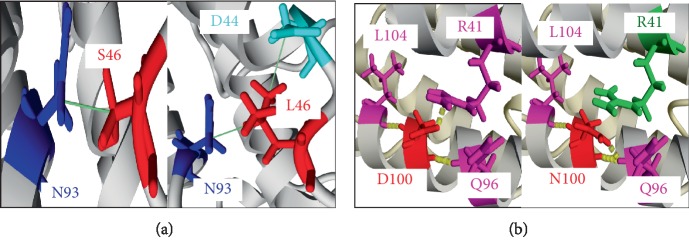
Figure 4.
Comparison of the native leptin protein structure and two mutant forms. (a) S46 (wild type-Leptin) and 46 L (variant protein). (b) D100 (wild type-Leptin) 100 N (variant protein). Residues substituted are showed in red, residues involved in hydrogen bonds are marked in magenta, residues participate in hydrophobic interactions are indicated in blue, the residues which lost a hydrogen bonds and/or hydrophobic interactions are marked in green, the new residues appeared are indicated in cyan. Hydrogen bonding are marked by yellow dashed lines and hydrophobic interactions are showed by green lines.

