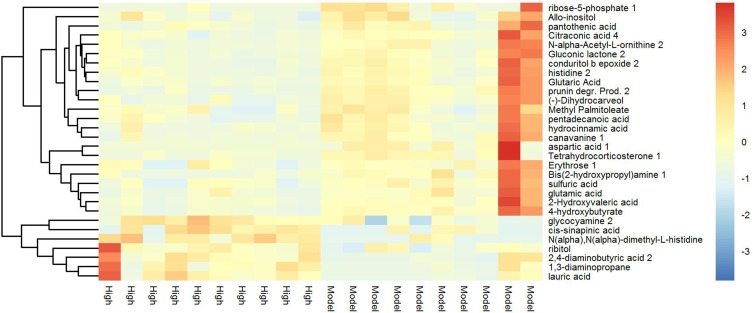
Figure 7.
Heat map of hierarchical clustering analysis for MOD vs HIG. The abscissa represents different experimental groups, the ordinate represents the contrasting differential metabolites between these groups, and the color blocks at different positions represent the relative expression of metabolites at corresponding positions.

