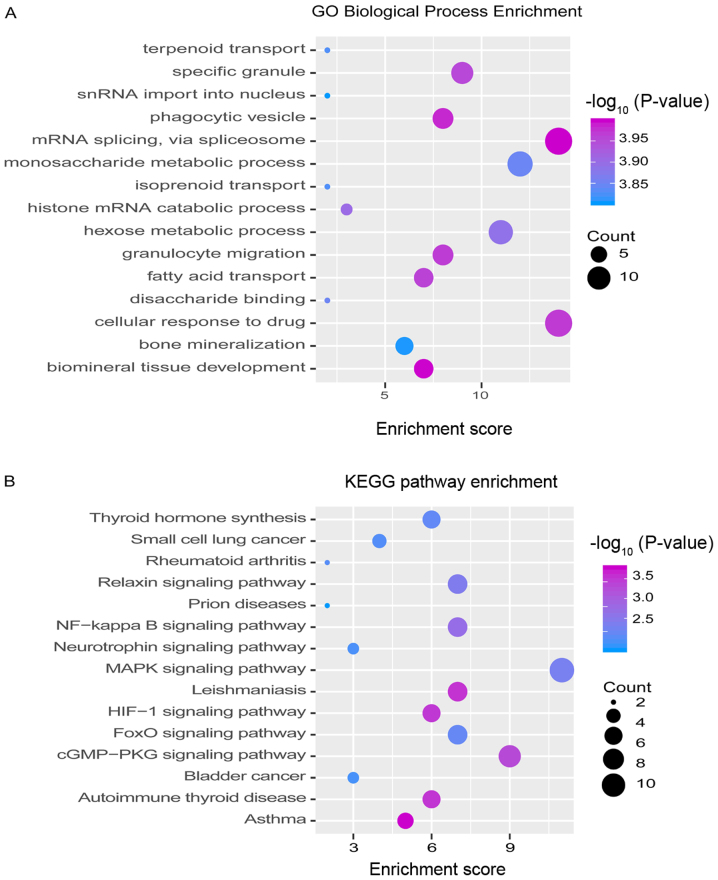
Figure 2.
Modular genes participate in function and pathway identification of OA dysfunction module. (A) GO functional enrichment analysis involving module genes. The darker the color, the stronger the significance of enrichment. The larger the circle, the larger the proportion of module genes in GO functional entry genes. (B) Enrichment analysis of KEGG pathway involving modular genes. The darker the color, the stronger the significance of enrichment. The larger the circle, the larger the proportion of module genes to KEGG pathway entry genes. OA, osteoarthritis.

