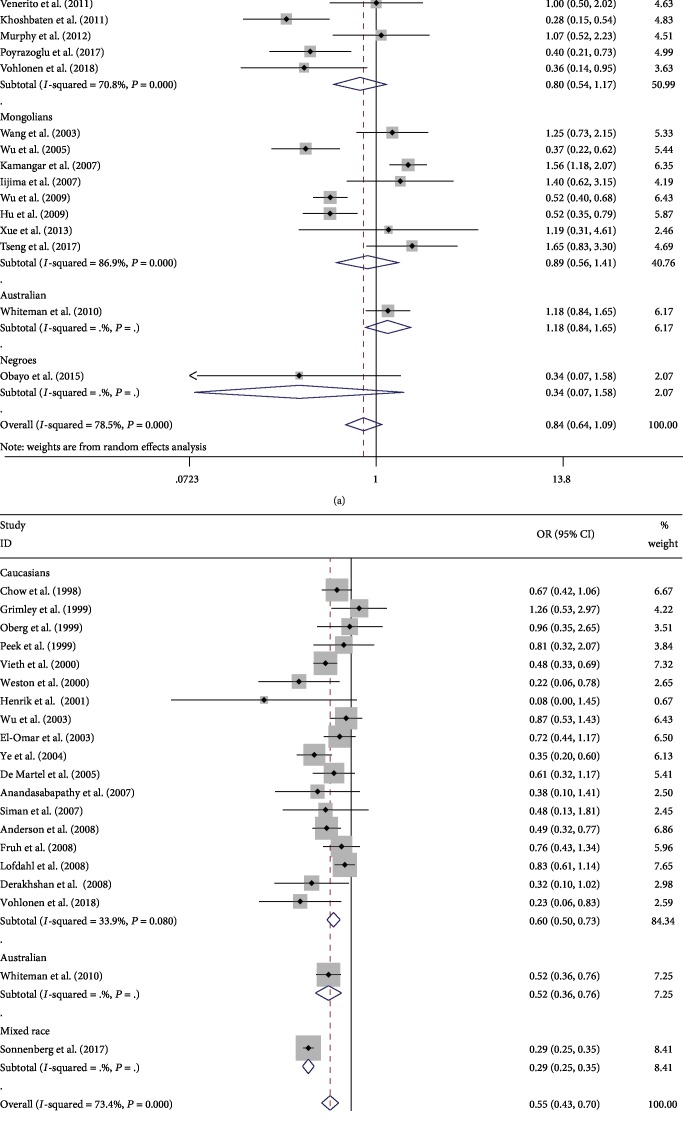
Figure 2.
Meta-analysis of the association between Helicobacter pylori infection and esophageal cancer after grouping based on ethnicity: (a) forest plot of esophageal squamous cell carcinoma; (b) forest plot of esophageal adenocarcinoma. Each horizontal bar summarizes a study. Bars represent 95% CIs. Gray squares inform on each of the studies' weight in the meta-analysis. Diamond in the lower part of the graph depicts the pooled estimate along with 95% CIs.

