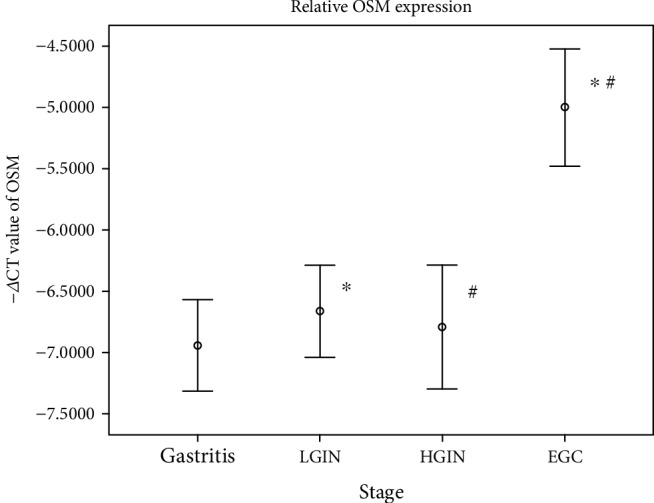
Figure 2.

The expression level of the OSM gene was verified by qPCR in a group of gastric tissue samples. −△CTOSM indicated the expression level of the OSM gene, and the results were represented as the mean ± standard. The values of −△CTOSM among the four groups were subjected to variance analysis, and the homogeneity test of variance revealed P = 0.843, with homogeneous variance. ∗Significant differences in the mean values between the LGIN and EGC groups (unpaired t test, P = 0.008); #significant differences in the mean values between the HGIN and EGC groups (unpaired t test, P = 0.014).
