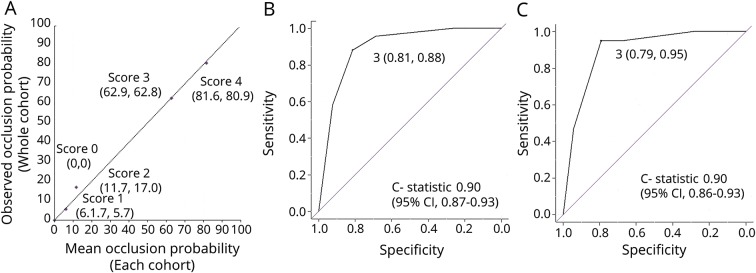
Figure 2. Goodness of fit of the multivariable logistic regression analysis model and validity of the GAI2AA scale.
(A) Estimated (x-axis) vs observed (y-axis) values of the probability of an occlusion associated with each score with a reference to the diagonal dotted line, which represents perfect calibration. The receiver operating characteristic curve analysis of the (B) retrospective and (C) prospective cohort showing the sensitivity and specificity of a score of 3 and the C statistics. CI = confidence interval.

