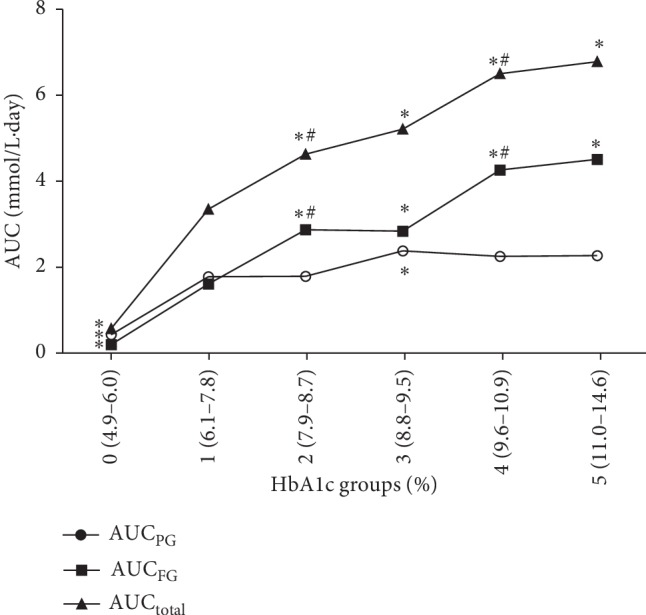
Figure 1.

Area under the glucose curve derived from continuous glucose monitoring over groups of HbA1c. ∗Significant differences from group 1. #Significant differences from the lower one group. Area under the glucose curve (AUC)FG = AUCtotal − AUCPG.
