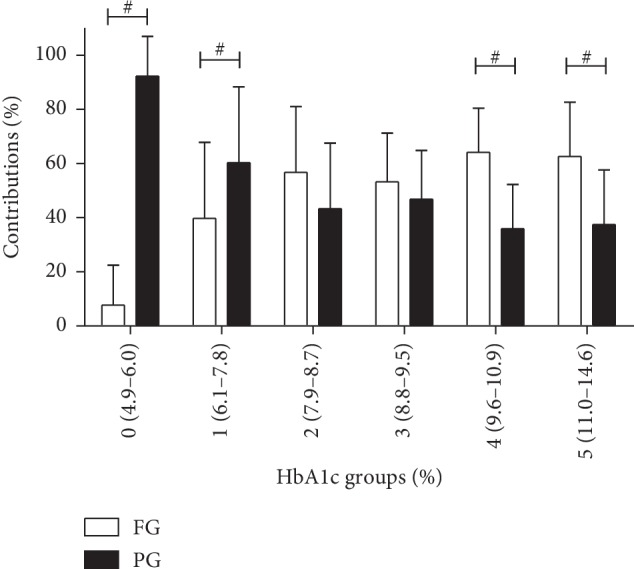
Figure 2.

The relative contributions of fasting and postprandial glucose to overall glucose increment (%) over groups of HbA1c. #Significant differences were observed between fasting and postprandial glucose (paired t-test). Area under the glucose curve (AUC)FG = AUCtotal − AUCPG.
