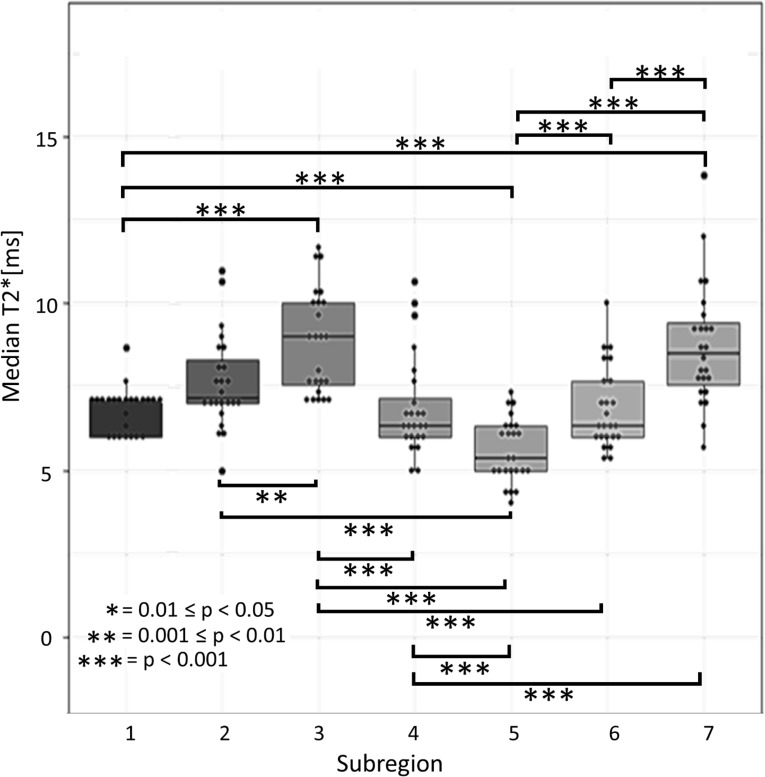
Figure 2. .
Boxplots for TPT subregion T2* values, with plotted points indicating the median T2* value for each individual subject and the horizontal lines in each box representing the median T2* value for all subjects. The upper and lower boundaries of the box show the upper and lower quartiles. The whiskers show the highest and lowest value excluding the outliers. Significant differences in mean T2* between regions are indicated with brackets and asterisks. TPT, tibialis posterior tendon.

