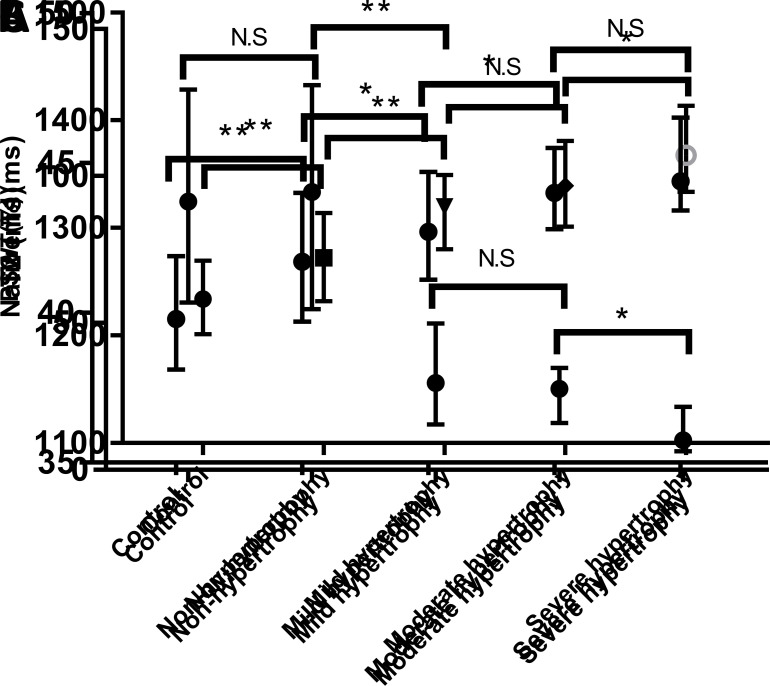
Figure 2. .
Native T1 values (A), T2 values (B) and PSWT (C) in the normal segments in healthy controls, non-hypertrophic, mild-hypertrophic, moderate-hypertrophic, and severe hypertrophic segments. The error bars represents the median with interquartile range. (**: p < 0.001;*: p < 0.05; N.S : p > 0.05). PSWT,percentage of systolic wall thickening.

