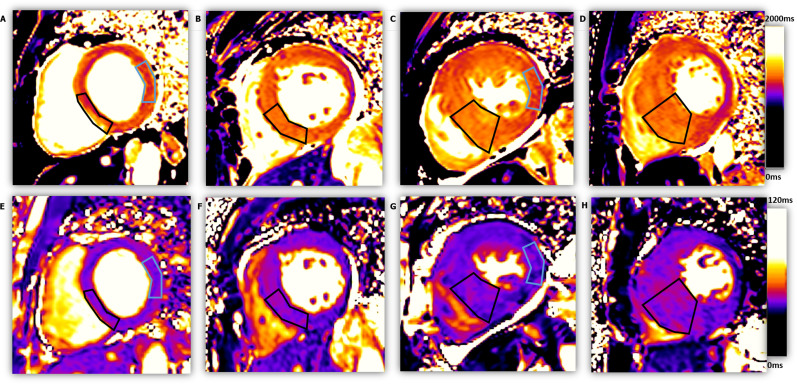
Figure 3. .
The native T1 mapping and T2 mapping images of four subjects, from left to right: one healthy control and three patients with different HCM severity. ROIs with black outline shows the mid-inferoseptal wall of each subjects for segmental analysis (from left to right: EDTH = 8.0 mm, 15.1 mm, 21.8 mm, 25.5 mm; T1 = 1241.8 ms, 1302.8 ms, 1365.3 ms, 1400.2 ms; T2 = 39.1 ms, 43.5 ms, 44.6 ms, 45.6 ms). The ROI with blue outline in C and G highlight a non-hypertrophic myocardial segment (EDTH = 7.3 mm, T1 = 1283.3 ms, T2 = 42.0 ms), as compared to a normal myocardial segment in A and E (EDTH = 7.1 mm, T1 = 1230.1 ms, T2 = 37.6 ms). EDTH, end-diastolic wall thickness; ROI, region ofinterest.

